> ## Documentation Index
> Fetch the complete documentation index at: https://docs.valar.space/llms.txt
> Use this file to discover all available pages before exploring further.
# Ground Track Visualization
> Visualize spacecraft ground tracks on interactive 3D globe
> For the complete documentation index, see [llms.txt](/llms.txt).
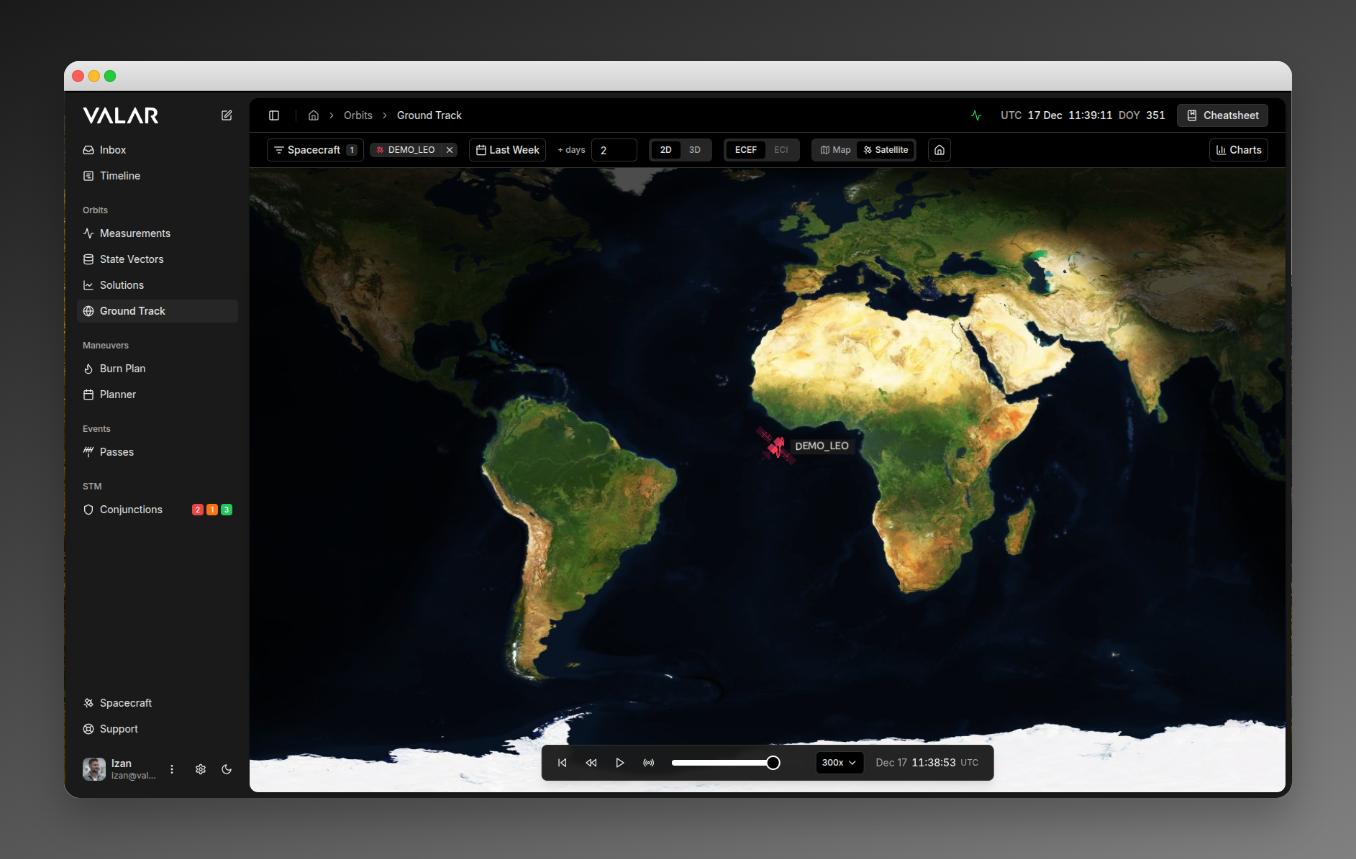
The Ground Track page displays real-time and predicted satellite positions on an interactive 3D globe or 2D map. It shows spacecraft orbital paths (ground tracks) and allows you to visualize satellite positions over time.
**Route:** `/orbits/ground-track`
## Page Layout
 ## Filtering & View Controls
### Spacecraft Filter
Filter which spacecraft trajectories are displayed on the map.
| Element | Description |
| ----------- | --------------------------------------- |
| **Control** | Multi-select dropdown with badge |
| **Default** | Shows all spacecraft when none selected |
**Actions:**
* Click to open popover dropdown
* Check/uncheck spacecraft to display
* Click **Apply** to confirm selection
* Click **Clear All** to deselect all
* Remove individual spacecraft via **X** button on badges
### Scene Mode Toggle (2D / 3D)
| Mode | Description |
| ------ | ------------------------------------------ |
| **2D** | Flat map view with Web Mercator projection |
| **3D** | Full 3D globe with free camera rotation |
**Default:** 2D
**2D Mode Characteristics:**
* Flat map projection
* Latitude limited to ±85° (Web Mercator constraint)
* No camera tilt/rotation
* Best for traditional ground track visualization
**3D Mode Characteristics:**
* Spherical Earth globe
* Full camera freedom (rotate, tilt, zoom)
* Realistic lighting with day/night terminator
* Required for ECI reference frame
**Transition:** Smooth 1-second morph animation between modes.
### Reference Frame Toggle (ECEF / ECI)
| Frame | Description |
| -------- | -------------------------------------------- |
| **ECEF** | Earth-Centered Earth-Fixed (ground-relative) |
| **ECI** | Earth-Centered Inertial (space-fixed) |
**Default:** ECEF
**ECEF (Earth-Fixed):**
* Standard ground track view
* Earth rotates with you (fixed ground reference)
* Shows subsatellite point traces
* Available in 2D and 3D
**ECI (Inertial):**
* Space-fixed reference frame
* Earth rotates beneath the camera
* Shows true orbital path in space
* Only available in 3D mode (tab disabled in 2D)
* Automatically switches to ECEF when entering 2D mode
A reference-frame indicator badge appears in the viewer header alongside the ECEF / ECI toggle, showing the active frame (`ECEF` or `ECI`). The badge updates as you flip the toggle — it always reflects the frame the rendered geometry is currently expressed in. Hover the badge for the full frame name; click **Learn more** to open the [reference frame catalog](/platform-overview/reference-frames).
### Map Style Toggle (Map / Satellite)
| Style | Description |
| ------------- | --------------------------------------------------------- |
| **Map** | Theme-aware vector map (light/dark based on system theme) |
| **Satellite** | Satellite imagery (photographic) |
**Default:** Map
**Map Style:**
* Light theme: Mapbox light-v11
* Dark theme: Mapbox dark-v11
* Clean vector style for clear visualization
**Satellite Style:**
* Photographic satellite imagery
* Mapbox satellite-v9
* Real-world terrain appearance
### Home Button (Reset View)
Resets camera to default view.
**Effect:**
* Resets zoom to show full world extent
* Centers map on 0°, 0° (Atlantic Ocean)
* Resets any rotation/tilt (in 3D)
### Charts Button
Opens/closes the charts side panel. Click to toggle the sliding panel from the right edge.
## Map Visualization
### Satellite Icons
Each spacecraft is displayed with:
| Element | Description |
| ------------------ | ------------------------------------ |
| **Satellite icon** | Custom icon at current position |
| **Color** | Unique color per spacecraft |
| **Name label** | Spacecraft name to the right of icon |
**Label Styling:**
* Semi-transparent background box
* Theme-aware colors (adapts to light/dark mode)
* Always visible (no depth occlusion)
### Orbital Paths (Ground Tracks)
**Past Track (Trail):**
* Dashed line style
* Semi-transparent (70% opacity)
* Shows 1 hour of past positions
* Same color as spacecraft
**Future Track (Lead):**
* Solid line style
* Full opacity
* Shows 1 day of predicted positions
* Same color as spacecraft
### Map Interaction
| Action | 2D Mode | 3D Mode |
| ------------ | ---------------------------------- | ---------------------------------- |
| **Pan/Drag** | Click and drag to pan | Click and drag to rotate globe |
| **Zoom** | Mouse scroll wheel / pinch gesture | Mouse scroll wheel / pinch gesture |
| **Tilt** | Not available | Right-click drag / two-finger drag |
### Lighting Effects
The map displays realistic sun lighting with a day/night terminator that shows illuminated vs shadowed regions and moves with simulation time.
## Timeline Controls
Floating toolbar at bottom center of the map:
## Filtering & View Controls
### Spacecraft Filter
Filter which spacecraft trajectories are displayed on the map.
| Element | Description |
| ----------- | --------------------------------------- |
| **Control** | Multi-select dropdown with badge |
| **Default** | Shows all spacecraft when none selected |
**Actions:**
* Click to open popover dropdown
* Check/uncheck spacecraft to display
* Click **Apply** to confirm selection
* Click **Clear All** to deselect all
* Remove individual spacecraft via **X** button on badges
### Scene Mode Toggle (2D / 3D)
| Mode | Description |
| ------ | ------------------------------------------ |
| **2D** | Flat map view with Web Mercator projection |
| **3D** | Full 3D globe with free camera rotation |
**Default:** 2D
**2D Mode Characteristics:**
* Flat map projection
* Latitude limited to ±85° (Web Mercator constraint)
* No camera tilt/rotation
* Best for traditional ground track visualization
**3D Mode Characteristics:**
* Spherical Earth globe
* Full camera freedom (rotate, tilt, zoom)
* Realistic lighting with day/night terminator
* Required for ECI reference frame
**Transition:** Smooth 1-second morph animation between modes.
### Reference Frame Toggle (ECEF / ECI)
| Frame | Description |
| -------- | -------------------------------------------- |
| **ECEF** | Earth-Centered Earth-Fixed (ground-relative) |
| **ECI** | Earth-Centered Inertial (space-fixed) |
**Default:** ECEF
**ECEF (Earth-Fixed):**
* Standard ground track view
* Earth rotates with you (fixed ground reference)
* Shows subsatellite point traces
* Available in 2D and 3D
**ECI (Inertial):**
* Space-fixed reference frame
* Earth rotates beneath the camera
* Shows true orbital path in space
* Only available in 3D mode (tab disabled in 2D)
* Automatically switches to ECEF when entering 2D mode
A reference-frame indicator badge appears in the viewer header alongside the ECEF / ECI toggle, showing the active frame (`ECEF` or `ECI`). The badge updates as you flip the toggle — it always reflects the frame the rendered geometry is currently expressed in. Hover the badge for the full frame name; click **Learn more** to open the [reference frame catalog](/platform-overview/reference-frames).
### Map Style Toggle (Map / Satellite)
| Style | Description |
| ------------- | --------------------------------------------------------- |
| **Map** | Theme-aware vector map (light/dark based on system theme) |
| **Satellite** | Satellite imagery (photographic) |
**Default:** Map
**Map Style:**
* Light theme: Mapbox light-v11
* Dark theme: Mapbox dark-v11
* Clean vector style for clear visualization
**Satellite Style:**
* Photographic satellite imagery
* Mapbox satellite-v9
* Real-world terrain appearance
### Home Button (Reset View)
Resets camera to default view.
**Effect:**
* Resets zoom to show full world extent
* Centers map on 0°, 0° (Atlantic Ocean)
* Resets any rotation/tilt (in 3D)
### Charts Button
Opens/closes the charts side panel. Click to toggle the sliding panel from the right edge.
## Map Visualization
### Satellite Icons
Each spacecraft is displayed with:
| Element | Description |
| ------------------ | ------------------------------------ |
| **Satellite icon** | Custom icon at current position |
| **Color** | Unique color per spacecraft |
| **Name label** | Spacecraft name to the right of icon |
**Label Styling:**
* Semi-transparent background box
* Theme-aware colors (adapts to light/dark mode)
* Always visible (no depth occlusion)
### Orbital Paths (Ground Tracks)
**Past Track (Trail):**
* Dashed line style
* Semi-transparent (70% opacity)
* Shows 1 hour of past positions
* Same color as spacecraft
**Future Track (Lead):**
* Solid line style
* Full opacity
* Shows 1 day of predicted positions
* Same color as spacecraft
### Map Interaction
| Action | 2D Mode | 3D Mode |
| ------------ | ---------------------------------- | ---------------------------------- |
| **Pan/Drag** | Click and drag to pan | Click and drag to rotate globe |
| **Zoom** | Mouse scroll wheel / pinch gesture | Mouse scroll wheel / pinch gesture |
| **Tilt** | Not available | Right-click drag / two-finger drag |
### Lighting Effects
The map displays realistic sun lighting with a day/night terminator that shows illuminated vs shadowed regions and moves with simulation time.
## Timeline Controls
Floating toolbar at bottom center of the map:
 ### Reset to Start
Jumps to the beginning of the data timeline.
### Reverse Button
Plays animation backwards.
| State | Behavior |
| ------------------------ | -------------------------------------------- |
| **Normal** | Click to start reverse playback |
| **Active (highlighted)** | Currently playing in reverse, click to pause |
### Play/Pause Button /
Toggles forward playback.
| Icon | State |
| ------------------------------- | ----------------------------------------- |
| **Play** | Animation paused, click to play forward |
| **Pause** | Animation playing forward, click to pause |
### Real-Time Sync Button
Syncs simulation to current real-world time.
| State | Behavior |
| ------------------------ | ----------------------------- |
| **Normal** | Click to jump to current time |
| **Active (highlighted)** | Currently in real-time mode |
**Effect:**
* Jumps simulation to current system time
* Continues advancing with real clock
* Disables timeline slider (can't scrub in real-time mode)
### Timeline Slider
Drag to scrub through the timeline. The slider moves in 0.1% increments across the full data range.
The timeline slider is disabled when in real-time mode.
### Speed Selector
Click to open speed selection popover.
| Speed | Description |
| -------- | --------------------- |
| 0.5x | Half real-time |
| 1x | Real-time |
| 2x | 2× faster |
| 5x | 5× faster |
| 10x | 10× faster |
| 50x | 50× faster |
| 100x | 100× faster |
| **300x** | 300× faster (default) |
| 1000x | 1000× faster |
### Time Display
Shows the current simulation time in `Mon DD HH:MM:SS UTC` format (e.g., "Nov 12 14:32:15 UTC"). Hover to see the full ISO date.
## Charts Side Panel
Access the charts panel by clicking the **Charts** button in the topbar. The panel opens on the right side of the screen.
### Latitude / Longitude Chart
| Property | Value |
| ---------- | ------------------- |
| **Type** | Scatter/line plot |
| **X-axis** | Longitude (degrees) |
| **Y-axis** | Latitude (degrees) |
Shows ground track pattern with longitude wrapping (±180°), color-coded by spacecraft.
### Latitude vs Time Chart
| Property | Value |
| ---------- | ---------------------- |
| **Type** | Time series line chart |
| **X-axis** | Time |
| **Y-axis** | Latitude (degrees) |
Shows latitude variation over time, revealing orbital inclination patterns.
### Longitude vs Time Chart
| Property | Value |
| ---------- | ---------------------- |
| **Type** | Time series line chart |
| **X-axis** | Time |
| **Y-axis** | Longitude (degrees) |
Shows longitude drift over time, revealing orbital period. Handles 360° wrapping discontinuities.
### Chart Interactions
* **Hover:** Shows tooltip with exact values
* **Empty State:** "No data available" message with icon
* **Loading:** Skeleton placeholders while loading
## Data & Time Range
### Default Data Range
| Direction | Range |
| ---------- | ------------------------ |
| **Past** | 0 days (starts from now) |
| **Future** | 2 days ahead |
### Data Sampling
| Context | Configuration |
| ------------- | ------------------------------ |
| **Map** | Max 500 points per satellite |
| **Time step** | 10 minutes (600 seconds) |
| **Charts** | Max 300 points for performance |
### Data Caching
* 5-minute cache per spacecraft/time-range
* Automatic deduplication of requests
## When the orbit is stale or unusable
The map draws each spacecraft from a **fresh** orbit. A spacecraft's [orbit age](/features/orbit-age#orbit-age) is measured from its latest [state vector](/features/state-vectors) — the position and velocity at an epoch you provide through orbit determination, an [OPM](/file-formats/opm) import, or manual entry. As that age grows it crosses two levels in turn — the [degraded level](/features/orbit-age#degraded-level), then the [stale level](/features/orbit-age#stale-level) — and the map reacts differently at each. The track normally draws the moment you open the page; on a stale orbit it waits for you to choose to proceed.
What you see depends on the selected spacecraft's orbit age:
| Orbit state | What the map shows |
| ---------------------------------------------------------------------------- | ------------------------------------------------------------------------------------------------------------------------------------------------------------------------------------------------------------------------------------------------------------------------------------------------------------------------------------------------------------------------------------------------------------------------------------------------------- |
| **Fresh** (within both levels) | The ground track, globe position, and charts draw normally — nothing extra. |
| **Degraded** (past the [degraded level](/features/orbit-age#degraded-level)) | The track draws from the platform-fetched public [TLE](/file-formats/tle), with an inline aging notice above the map reading **This spacecraft's orbit is stale**, the orbit's age (`last determined N days ago`), and the level it crossed (`exceeds your N-day threshold`). When the fallback orbit is itself stale, the notice adds **the public-TLE fallback is also stale**. The track still draws — the notice is a heads-up, not a block. |
| **Stale** (past the [stale level](/features/orbit-age#stale-level)) | The track is **held** until you choose to proceed. In place of the map, the page shows the same **This spacecraft's orbit is stale** panel — with the age and threshold lines — plus a **Compute anyway** button. Click **Compute anyway** to draw the ground track and globe position from the stale orbit. |
| **No usable orbit** | When a selected spacecraft has no orbit data of any kind to draw from, the map is replaced by a panel reading **Can't compute — `{spacecraft}` has no usable orbit**, explaining that **There is no usable orbit data for this spacecraft, so this product can't be computed. Add tracking data to continue**, with an **Add orbit data** button that opens the [Spacecraft](/features/spacecraft-management) page. This is never shown as a raw error. |
Both `N` values are whole days — the spacecraft's actual orbit age and your configured stale level. The stale and degraded levels are workspace-wide values set once in **Settings → Orbits → Orbit age** (stale level default `14 days`); the same values govern the [Keplerian-elements plot](/features/orbit-elements-plots) and [AOI overflight](/features/areas-of-interest/overflight-events), changed in one place rather than per surface. See [Orbit age](/features/orbit-age#stale-level) for the workspace-wide policy and the block message.
Every spacecraft affected at either level is also named in the unified [orbit-data-age footer](/features/orbit-age#the-orbit-data-age-footer) at the bottom of the page — tagged **Degraded** at the degraded level, or **Blocked** once past the stale level — so you can see which spacecraft are affected at a glance.
## Loading & Error States
| State | Display |
| ------------------------- | ------------------------------ |
| **Initial load** | "Loading map..." skeleton |
| **Cesium loading** | Map skeleton with loading text |
| **Data loading** | Map skeleton until data ready |
| **Charts loading** | Skeleton cards in panel |
| **Spacecraft data error** | Red error message with details |
| **Orbit data error** | Red error message with details |
## Quick Reference
| Category | Action | Control |
| -------- | ------------------ | --------------------------------------------------- |
| Filter | Select spacecraft | Topbar dropdown |
| View | Switch 2D/3D | Topbar tabs |
| View | Switch ECEF/ECI | Topbar tabs |
| View | Change map style | Topbar tabs |
| View | Reset camera | Home button |
| View | Open/close charts | Charts button |
| Playback | Reset to start | button |
| Playback | Play reverse | button |
| Playback | Play/pause forward | / button |
| Playback | Sync to real-time | button |
| Playback | Scrub timeline | Slider drag |
| Playback | Change speed | Speed dropdown |
| Map | Pan/drag | Mouse drag |
| Map | Zoom | Scroll wheel |
| Map | Rotate (3D) | Right-click drag |
| Charts | View coordinates | Hover on chart |
### Reset to Start
Jumps to the beginning of the data timeline.
### Reverse Button
Plays animation backwards.
| State | Behavior |
| ------------------------ | -------------------------------------------- |
| **Normal** | Click to start reverse playback |
| **Active (highlighted)** | Currently playing in reverse, click to pause |
### Play/Pause Button /
Toggles forward playback.
| Icon | State |
| ------------------------------- | ----------------------------------------- |
| **Play** | Animation paused, click to play forward |
| **Pause** | Animation playing forward, click to pause |
### Real-Time Sync Button
Syncs simulation to current real-world time.
| State | Behavior |
| ------------------------ | ----------------------------- |
| **Normal** | Click to jump to current time |
| **Active (highlighted)** | Currently in real-time mode |
**Effect:**
* Jumps simulation to current system time
* Continues advancing with real clock
* Disables timeline slider (can't scrub in real-time mode)
### Timeline Slider
Drag to scrub through the timeline. The slider moves in 0.1% increments across the full data range.
The timeline slider is disabled when in real-time mode.
### Speed Selector
Click to open speed selection popover.
| Speed | Description |
| -------- | --------------------- |
| 0.5x | Half real-time |
| 1x | Real-time |
| 2x | 2× faster |
| 5x | 5× faster |
| 10x | 10× faster |
| 50x | 50× faster |
| 100x | 100× faster |
| **300x** | 300× faster (default) |
| 1000x | 1000× faster |
### Time Display
Shows the current simulation time in `Mon DD HH:MM:SS UTC` format (e.g., "Nov 12 14:32:15 UTC"). Hover to see the full ISO date.
## Charts Side Panel
Access the charts panel by clicking the **Charts** button in the topbar. The panel opens on the right side of the screen.
### Latitude / Longitude Chart
| Property | Value |
| ---------- | ------------------- |
| **Type** | Scatter/line plot |
| **X-axis** | Longitude (degrees) |
| **Y-axis** | Latitude (degrees) |
Shows ground track pattern with longitude wrapping (±180°), color-coded by spacecraft.
### Latitude vs Time Chart
| Property | Value |
| ---------- | ---------------------- |
| **Type** | Time series line chart |
| **X-axis** | Time |
| **Y-axis** | Latitude (degrees) |
Shows latitude variation over time, revealing orbital inclination patterns.
### Longitude vs Time Chart
| Property | Value |
| ---------- | ---------------------- |
| **Type** | Time series line chart |
| **X-axis** | Time |
| **Y-axis** | Longitude (degrees) |
Shows longitude drift over time, revealing orbital period. Handles 360° wrapping discontinuities.
### Chart Interactions
* **Hover:** Shows tooltip with exact values
* **Empty State:** "No data available" message with icon
* **Loading:** Skeleton placeholders while loading
## Data & Time Range
### Default Data Range
| Direction | Range |
| ---------- | ------------------------ |
| **Past** | 0 days (starts from now) |
| **Future** | 2 days ahead |
### Data Sampling
| Context | Configuration |
| ------------- | ------------------------------ |
| **Map** | Max 500 points per satellite |
| **Time step** | 10 minutes (600 seconds) |
| **Charts** | Max 300 points for performance |
### Data Caching
* 5-minute cache per spacecraft/time-range
* Automatic deduplication of requests
## When the orbit is stale or unusable
The map draws each spacecraft from a **fresh** orbit. A spacecraft's [orbit age](/features/orbit-age#orbit-age) is measured from its latest [state vector](/features/state-vectors) — the position and velocity at an epoch you provide through orbit determination, an [OPM](/file-formats/opm) import, or manual entry. As that age grows it crosses two levels in turn — the [degraded level](/features/orbit-age#degraded-level), then the [stale level](/features/orbit-age#stale-level) — and the map reacts differently at each. The track normally draws the moment you open the page; on a stale orbit it waits for you to choose to proceed.
What you see depends on the selected spacecraft's orbit age:
| Orbit state | What the map shows |
| ---------------------------------------------------------------------------- | ------------------------------------------------------------------------------------------------------------------------------------------------------------------------------------------------------------------------------------------------------------------------------------------------------------------------------------------------------------------------------------------------------------------------------------------------------- |
| **Fresh** (within both levels) | The ground track, globe position, and charts draw normally — nothing extra. |
| **Degraded** (past the [degraded level](/features/orbit-age#degraded-level)) | The track draws from the platform-fetched public [TLE](/file-formats/tle), with an inline aging notice above the map reading **This spacecraft's orbit is stale**, the orbit's age (`last determined N days ago`), and the level it crossed (`exceeds your N-day threshold`). When the fallback orbit is itself stale, the notice adds **the public-TLE fallback is also stale**. The track still draws — the notice is a heads-up, not a block. |
| **Stale** (past the [stale level](/features/orbit-age#stale-level)) | The track is **held** until you choose to proceed. In place of the map, the page shows the same **This spacecraft's orbit is stale** panel — with the age and threshold lines — plus a **Compute anyway** button. Click **Compute anyway** to draw the ground track and globe position from the stale orbit. |
| **No usable orbit** | When a selected spacecraft has no orbit data of any kind to draw from, the map is replaced by a panel reading **Can't compute — `{spacecraft}` has no usable orbit**, explaining that **There is no usable orbit data for this spacecraft, so this product can't be computed. Add tracking data to continue**, with an **Add orbit data** button that opens the [Spacecraft](/features/spacecraft-management) page. This is never shown as a raw error. |
Both `N` values are whole days — the spacecraft's actual orbit age and your configured stale level. The stale and degraded levels are workspace-wide values set once in **Settings → Orbits → Orbit age** (stale level default `14 days`); the same values govern the [Keplerian-elements plot](/features/orbit-elements-plots) and [AOI overflight](/features/areas-of-interest/overflight-events), changed in one place rather than per surface. See [Orbit age](/features/orbit-age#stale-level) for the workspace-wide policy and the block message.
Every spacecraft affected at either level is also named in the unified [orbit-data-age footer](/features/orbit-age#the-orbit-data-age-footer) at the bottom of the page — tagged **Degraded** at the degraded level, or **Blocked** once past the stale level — so you can see which spacecraft are affected at a glance.
## Loading & Error States
| State | Display |
| ------------------------- | ------------------------------ |
| **Initial load** | "Loading map..." skeleton |
| **Cesium loading** | Map skeleton with loading text |
| **Data loading** | Map skeleton until data ready |
| **Charts loading** | Skeleton cards in panel |
| **Spacecraft data error** | Red error message with details |
| **Orbit data error** | Red error message with details |
## Quick Reference
| Category | Action | Control |
| -------- | ------------------ | --------------------------------------------------- |
| Filter | Select spacecraft | Topbar dropdown |
| View | Switch 2D/3D | Topbar tabs |
| View | Switch ECEF/ECI | Topbar tabs |
| View | Change map style | Topbar tabs |
| View | Reset camera | Home button |
| View | Open/close charts | Charts button |
| Playback | Reset to start | button |
| Playback | Play reverse | button |
| Playback | Play/pause forward | / button |
| Playback | Sync to real-time | button |
| Playback | Scrub timeline | Slider drag |
| Playback | Change speed | Speed dropdown |
| Map | Pan/drag | Mouse drag |
| Map | Zoom | Scroll wheel |
| Map | Rotate (3D) | Right-click drag |
| Charts | View coordinates | Hover on chart |