> ## Documentation Index
> Fetch the complete documentation index at: https://docs.valar.space/llms.txt
> Use this file to discover all available pages before exploring further.
# Viewing Measurements
> Visualize, filter, and manage measurement data
> For the complete documentation index, see [llms.txt](/llms.txt).
The Measurements page provides visualization and management tools for your measurement data. View measurements in interactive charts, filter by various criteria, and manage outlier status.
**Route:** `/orbits/measurements/data`
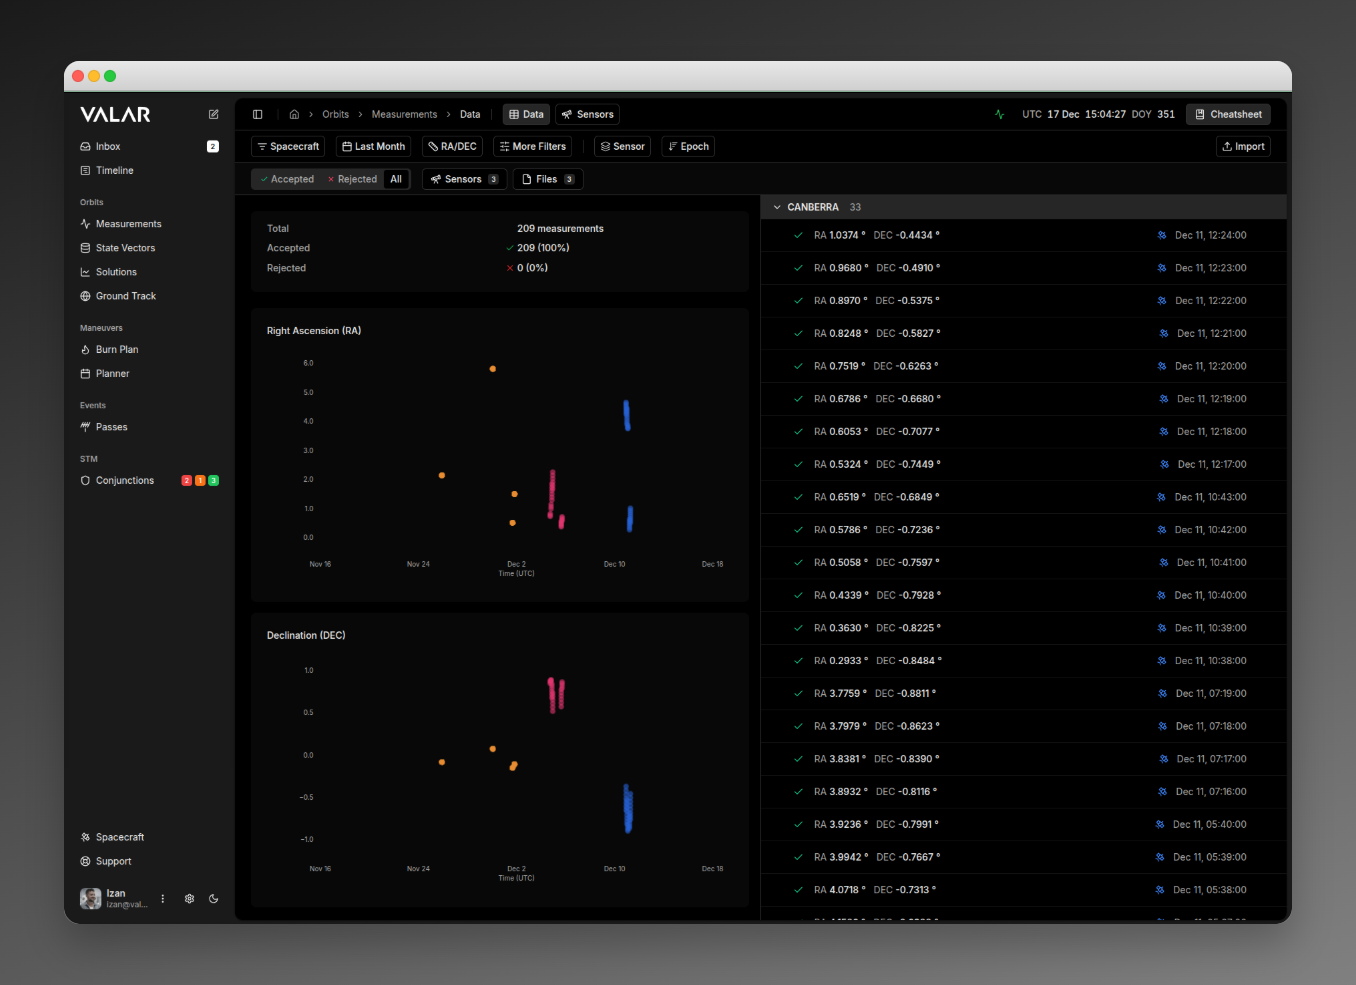
## Page Layout
The page uses a split-view design with a plot panel on the left and a table panel on the right:
 When measurements are selected, a floating action bar appears at the bottom:
 ## Filtering
### Spacecraft Filter
Filter measurements by spacecraft. Click to open a multi-select dropdown, check/uncheck spacecraft, and click **Apply** to confirm.
### Time Range Filter
| Option | Label | Description |
| --------- | ---------- | --------------------------------- |
| **day** | Today | From today at 00:00:00 UTC to now |
| **week** | Last Week | Last 7 days from midnight |
| **month** | Last Month | Last 30 days from midnight |
Only preset time ranges are available. There is no custom date range picker.
### Measurement Type Selector
| Type | Description | Chart Display |
| ----------- | ----------------------- | ------------------------------------------- |
| **RANGE** | Distance measurements | Single chart: Range (m) |
| **RADEC** | Sky coordinates | Two charts: RA (deg) + DEC (deg) |
| **AZEL** | Pointing angles | Two charts: Azimuth (deg) + Elevation (deg) |
| **PV** | Position & velocity | Six charts: X, Y, Z (m) + Vx, Vy, Vz (m/s) |
| **DOPPLER** | Range-rate observations | Single chart: Range-rate (m/s) |
The selector auto-selects the first available type when data loads and only shows types that have data.
### Advanced Filters
Click **More Filters** to expand additional filtering options.
#### Outlier Status Tabs
| Tab | Shows | Icon |
| ------------ | -------------------------------------- | --------------- |
| **Accepted** | Only non-outlier (normal) measurements | Green checkmark |
| **Rejected** | Only outlier measurements | Red X |
| **All** | All measurements regardless of status | None |
#### Sensors Filter
Click **Sensors** to open a popover with all available sensors. Click sensors to toggle selection, then click **Apply** to filter.
#### Files Filter
Click **Files** to open a popover with all source files. Click files to toggle selection, then click **Apply** to filter.
## Grouping
Click **Group By** to change how measurements are organized:
| Option | Table Behavior | Chart Behavior |
| -------------- | -------------------------------------------- | ------------------------------------- |
| **Sensor** | Groups by sensor ID with collapsible headers | Colors points by sensor, shows legend |
| **Spacecraft** | Groups by spacecraft name | Colors points by spacecraft |
| **File** | Groups by source file name | Colors points by file |
| **None** | Flat list (no grouping) | Single color, no legend |
### Group Header Actions
When grouping is enabled, each group header provides:
* **Chevron**: Click to expand/collapse the group
* **Select All**: Select all measurements in the group (appears on hover)
* **Clear**: Deselect all in group (appears when any are selected)
## Sorting
Click the **↓ Epoch** / **↑ Epoch** button to toggle sort order:
| State | Description |
| ------- | ------------------------- |
| ↓ Epoch | Newest first (descending) |
| ↑ Epoch | Oldest first (ascending) |
## Plot Panel
### Statistics Card
Above the charts, a statistics card displays:
* **Total**: Count of all measurements
* **Accepted**: Count with green checkmark and percentage
* **Rejected**: Count with red X and percentage
### Interacting with Data Points
**Hover** over any scatter point to see a tooltip with:
* Timestamp
* Value
* Sensor
* Status (Accepted/Rejected)
**Click** a data point to select it:
* Point becomes highlighted
* Tooltip stays visible with action buttons
* Corresponding table row highlights and scrolls into view
### Accept/Reject from Plot
When a point is selected, the tooltip shows an action button:
| Current Status | Button Shown | Action |
| -------------- | ------------ | -------------------- |
| Accepted | **Reject** | Marks as outlier |
| Rejected | **Accept** | Removes outlier flag |
## Table Panel
### Row Information
Each measurement row displays:
| Element | Description |
| ----------- | ------------------------------------------------------ |
| Checkbox | Click to select for bulk actions (appears on hover) |
| Status Icon | ✓ green (accepted) or ✗ red (rejected) |
| Values | Formatted by type (e.g., "RA 12.3456° DEC -45.6789°") |
| Epoch | Timestamp in "Jan 15, 14:32:01" format |
| More Menu | **⋮** button for additional actions (appears on hover) |
### Row Actions
**Click a row** (not the checkbox) to focus it:
* Row highlights with a colored ring
* Corresponding point on chart highlights
**Click the checkbox** to select for bulk actions:
* Row enters selection state
* Floating bulk actions bar appears
### Row Context Menu
Click the **⋮** button on any row to access:
| Action | Description |
| ------------------- | ---------------------------------------------- |
| **Accept / Reject** | Toggle outlier status for this measurement |
| **Accept File** | Mark ALL measurements in this file as accepted |
| **Reject File** | Mark ALL measurements in this file as rejected |
| **Delete File** | Delete ALL measurements from this file |
## Bulk Actions
When one or more rows are selected, a floating toolbar appears at the bottom.
### Selection Count
Shows the number of selected measurements out of total visible.
### Select All
Selects all visible measurements (after filters are applied).
### Reject / Accept Actions
| Option | Description |
| --------------- | --------------------------------------------------- |
| **Reject** | Mark selected measurements as outliers |
| **Accept File** | Mark ALL measurements in selected files as accepted |
| **Reject File** | Mark ALL measurements in selected files as rejected |
### Delete File
Opens a confirmation dialog to delete ALL measurements from the selected file(s).
**Delete File** removes all measurements from the source file(s), not just the selected rows. This action cannot be undone.
### Clear
Deselects all currently selected rows.
## Cross-Component Synchronization
The plot and table panels stay synchronized:
| Action | Effect |
| ------------------- | ----------------------------------------- |
| Click point in plot | Row highlights and auto-scrolls into view |
| Click row in table | Point highlights on chart |
| Click away | Highlights clear in both panels |
## Color Coding
### Status Colors
| Status | Color | Icon |
| ---------------- | ----- | ---- |
| Accepted | Green | ✓ |
| Rejected/Outlier | Red | ✗ |
### Series Colors
When grouping is enabled:
* **Sensor grouping**: Each sensor gets a unique color
* **Spacecraft grouping**: Uses spacecraft context colors
* **File grouping**: Each file gets a unique color
* **No grouping**: Single default color
The legend displays below the chart, or as color dots in the filter buttons when **More Filters** is visible.
## Loading States
While data is loading, the page displays skeleton placeholders:
* **Table**: 8 skeleton rows with placeholder shapes matching the actual row layout
* **Plot**: Loading indicator while chart data is prepared
## Chart Limitations
The scatter plot is view-only with the following characteristics:
| Feature | Supported |
| ------------------- | ------------------------ |
| **Zoom** | No |
| **Pan** | No |
| **Hover tooltips** | Yes |
| **Click to select** | Yes |
| **Data sampling** | No (all points rendered) |
Large datasets render all data points without sampling. For very large measurement sets, this may affect chart performance.
## Related Pages
* [Import measurements](/features/measurements-import): Upload TDM, OEM, and SP3 files
* [Manage sensors](/features/tracking-sensors): Configure ground stations for tracking
## Filtering
### Spacecraft Filter
Filter measurements by spacecraft. Click to open a multi-select dropdown, check/uncheck spacecraft, and click **Apply** to confirm.
### Time Range Filter
| Option | Label | Description |
| --------- | ---------- | --------------------------------- |
| **day** | Today | From today at 00:00:00 UTC to now |
| **week** | Last Week | Last 7 days from midnight |
| **month** | Last Month | Last 30 days from midnight |
Only preset time ranges are available. There is no custom date range picker.
### Measurement Type Selector
| Type | Description | Chart Display |
| ----------- | ----------------------- | ------------------------------------------- |
| **RANGE** | Distance measurements | Single chart: Range (m) |
| **RADEC** | Sky coordinates | Two charts: RA (deg) + DEC (deg) |
| **AZEL** | Pointing angles | Two charts: Azimuth (deg) + Elevation (deg) |
| **PV** | Position & velocity | Six charts: X, Y, Z (m) + Vx, Vy, Vz (m/s) |
| **DOPPLER** | Range-rate observations | Single chart: Range-rate (m/s) |
The selector auto-selects the first available type when data loads and only shows types that have data.
### Advanced Filters
Click **More Filters** to expand additional filtering options.
#### Outlier Status Tabs
| Tab | Shows | Icon |
| ------------ | -------------------------------------- | --------------- |
| **Accepted** | Only non-outlier (normal) measurements | Green checkmark |
| **Rejected** | Only outlier measurements | Red X |
| **All** | All measurements regardless of status | None |
#### Sensors Filter
Click **Sensors** to open a popover with all available sensors. Click sensors to toggle selection, then click **Apply** to filter.
#### Files Filter
Click **Files** to open a popover with all source files. Click files to toggle selection, then click **Apply** to filter.
## Grouping
Click **Group By** to change how measurements are organized:
| Option | Table Behavior | Chart Behavior |
| -------------- | -------------------------------------------- | ------------------------------------- |
| **Sensor** | Groups by sensor ID with collapsible headers | Colors points by sensor, shows legend |
| **Spacecraft** | Groups by spacecraft name | Colors points by spacecraft |
| **File** | Groups by source file name | Colors points by file |
| **None** | Flat list (no grouping) | Single color, no legend |
### Group Header Actions
When grouping is enabled, each group header provides:
* **Chevron**: Click to expand/collapse the group
* **Select All**: Select all measurements in the group (appears on hover)
* **Clear**: Deselect all in group (appears when any are selected)
## Sorting
Click the **↓ Epoch** / **↑ Epoch** button to toggle sort order:
| State | Description |
| ------- | ------------------------- |
| ↓ Epoch | Newest first (descending) |
| ↑ Epoch | Oldest first (ascending) |
## Plot Panel
### Statistics Card
Above the charts, a statistics card displays:
* **Total**: Count of all measurements
* **Accepted**: Count with green checkmark and percentage
* **Rejected**: Count with red X and percentage
### Interacting with Data Points
**Hover** over any scatter point to see a tooltip with:
* Timestamp
* Value
* Sensor
* Status (Accepted/Rejected)
**Click** a data point to select it:
* Point becomes highlighted
* Tooltip stays visible with action buttons
* Corresponding table row highlights and scrolls into view
### Accept/Reject from Plot
When a point is selected, the tooltip shows an action button:
| Current Status | Button Shown | Action |
| -------------- | ------------ | -------------------- |
| Accepted | **Reject** | Marks as outlier |
| Rejected | **Accept** | Removes outlier flag |
## Table Panel
### Row Information
Each measurement row displays:
| Element | Description |
| ----------- | ------------------------------------------------------ |
| Checkbox | Click to select for bulk actions (appears on hover) |
| Status Icon | ✓ green (accepted) or ✗ red (rejected) |
| Values | Formatted by type (e.g., "RA 12.3456° DEC -45.6789°") |
| Epoch | Timestamp in "Jan 15, 14:32:01" format |
| More Menu | **⋮** button for additional actions (appears on hover) |
### Row Actions
**Click a row** (not the checkbox) to focus it:
* Row highlights with a colored ring
* Corresponding point on chart highlights
**Click the checkbox** to select for bulk actions:
* Row enters selection state
* Floating bulk actions bar appears
### Row Context Menu
Click the **⋮** button on any row to access:
| Action | Description |
| ------------------- | ---------------------------------------------- |
| **Accept / Reject** | Toggle outlier status for this measurement |
| **Accept File** | Mark ALL measurements in this file as accepted |
| **Reject File** | Mark ALL measurements in this file as rejected |
| **Delete File** | Delete ALL measurements from this file |
## Bulk Actions
When one or more rows are selected, a floating toolbar appears at the bottom.
### Selection Count
Shows the number of selected measurements out of total visible.
### Select All
Selects all visible measurements (after filters are applied).
### Reject / Accept Actions
| Option | Description |
| --------------- | --------------------------------------------------- |
| **Reject** | Mark selected measurements as outliers |
| **Accept File** | Mark ALL measurements in selected files as accepted |
| **Reject File** | Mark ALL measurements in selected files as rejected |
### Delete File
Opens a confirmation dialog to delete ALL measurements from the selected file(s).
**Delete File** removes all measurements from the source file(s), not just the selected rows. This action cannot be undone.
### Clear
Deselects all currently selected rows.
## Cross-Component Synchronization
The plot and table panels stay synchronized:
| Action | Effect |
| ------------------- | ----------------------------------------- |
| Click point in plot | Row highlights and auto-scrolls into view |
| Click row in table | Point highlights on chart |
| Click away | Highlights clear in both panels |
## Color Coding
### Status Colors
| Status | Color | Icon |
| ---------------- | ----- | ---- |
| Accepted | Green | ✓ |
| Rejected/Outlier | Red | ✗ |
### Series Colors
When grouping is enabled:
* **Sensor grouping**: Each sensor gets a unique color
* **Spacecraft grouping**: Uses spacecraft context colors
* **File grouping**: Each file gets a unique color
* **No grouping**: Single default color
The legend displays below the chart, or as color dots in the filter buttons when **More Filters** is visible.
## Loading States
While data is loading, the page displays skeleton placeholders:
* **Table**: 8 skeleton rows with placeholder shapes matching the actual row layout
* **Plot**: Loading indicator while chart data is prepared
## Chart Limitations
The scatter plot is view-only with the following characteristics:
| Feature | Supported |
| ------------------- | ------------------------ |
| **Zoom** | No |
| **Pan** | No |
| **Hover tooltips** | Yes |
| **Click to select** | Yes |
| **Data sampling** | No (all points rendered) |
Large datasets render all data points without sampling. For very large measurement sets, this may affect chart performance.
## Related Pages
* [Import measurements](/features/measurements-import): Upload TDM, OEM, and SP3 files
* [Manage sensors](/features/tracking-sensors): Configure ground stations for tracking