For the complete documentation index, see llms.txt.
The Measurements page provides visualization and management tools for your measurement data. View measurements in interactive charts, filter by various criteria, and manage outlier status.
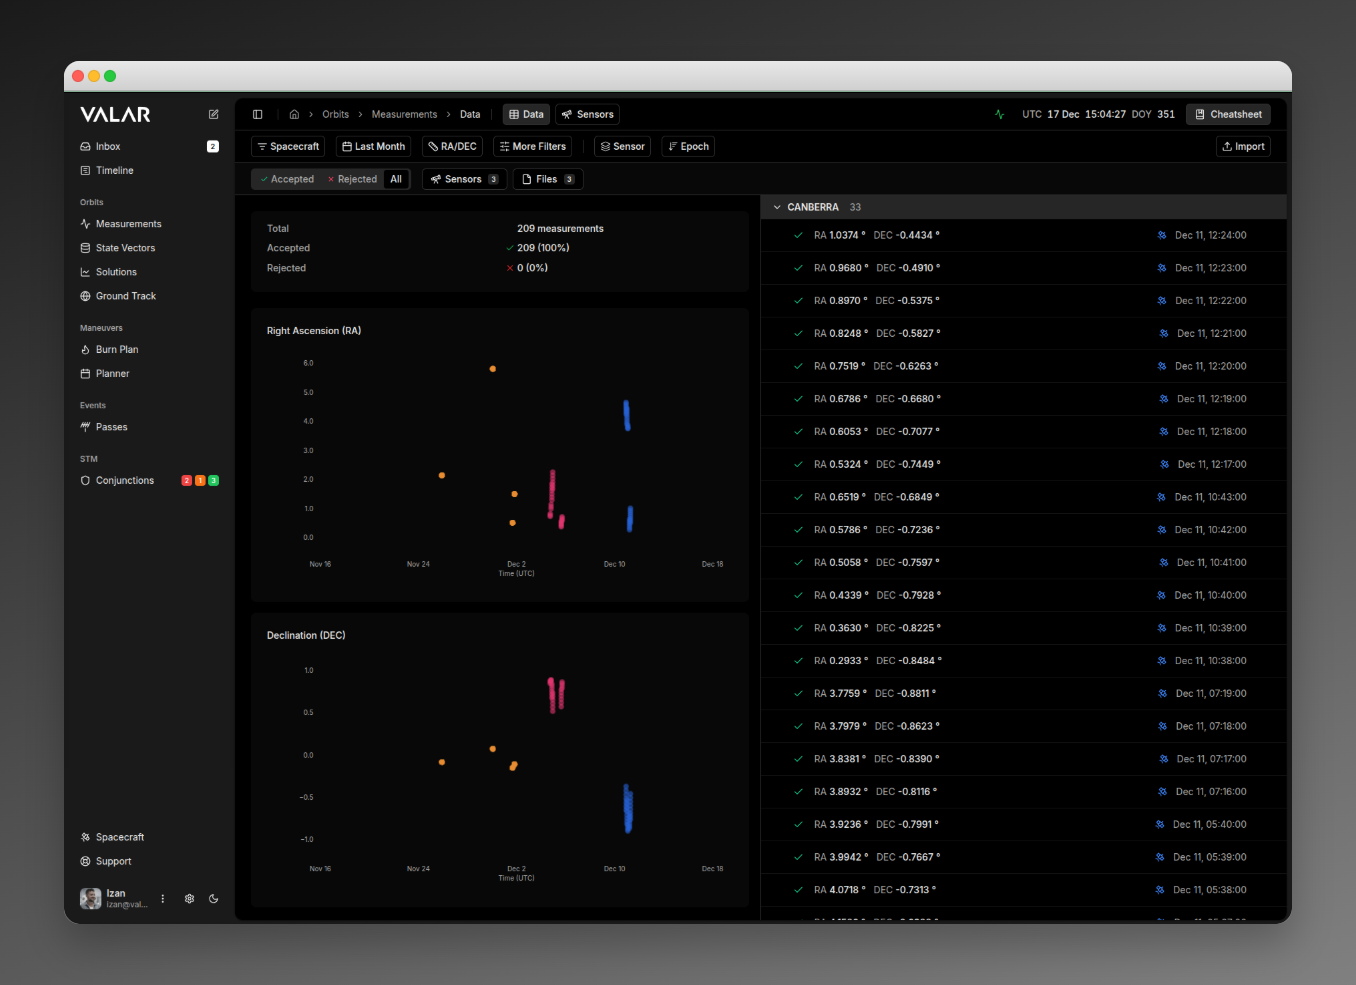
Route: /orbits/measurements/data
Page Layout
The page uses a split-view design with a plot panel on the left and a table panel on the right:
 When measurements are selected, a floating action bar appears at the bottom:

Filtering
Spacecraft Filter
Filter measurements by spacecraft. Click to open a multi-select dropdown, check/uncheck spacecraft, and click Apply to confirm.
Time Range Filter
| Option | Label | Description |
|---|
| day | Today | From today at 00:00:00 UTC to now |
| week | Last Week | Last 7 days from midnight |
| month | Last Month | Last 30 days from midnight |
Only preset time ranges are available. There is no custom date range picker.
Measurement Type Selector
| Type | Description | Chart Display |
|---|
| RANGE | Distance measurements | Single chart: Range (m) |
| RADEC | Sky coordinates | Two charts: RA (deg) + DEC (deg) |
| AZEL | Pointing angles | Two charts: Azimuth (deg) + Elevation (deg) |
| PV | Position & velocity | Six charts: X, Y, Z (m) + Vx, Vy, Vz (m/s) |
| DOPPLER | Range-rate observations | Single chart: Range-rate (m/s) |
Advanced Filters
Click More Filters to expand additional filtering options.
Outlier Status Tabs
| Tab | Shows | Icon |
|---|
| Accepted | Only non-outlier (normal) measurements | Green checkmark |
| Rejected | Only outlier measurements | Red X |
| All | All measurements regardless of status | None |
Sensors Filter
Click Sensors to open a popover with all available sensors. Click sensors to toggle selection, then click Apply to filter.
Files Filter
Click Files to open a popover with all source files. Click files to toggle selection, then click Apply to filter.
Grouping
Click Group By to change how measurements are organized:
| Option | Table Behavior | Chart Behavior |
|---|
| Sensor | Groups by sensor ID with collapsible headers | Colors points by sensor, shows legend |
| Spacecraft | Groups by spacecraft name | Colors points by spacecraft |
| File | Groups by source file name | Colors points by file |
| None | Flat list (no grouping) | Single color, no legend |
- Chevron: Click to expand/collapse the group
- Select All: Select all measurements in the group (appears on hover)
- Clear: Deselect all in group (appears when any are selected)
Sorting
Click the ↓ Epoch / ↑ Epoch button to toggle sort order:
| State | Description |
|---|
| ↓ Epoch | Newest first (descending) |
| ↑ Epoch | Oldest first (ascending) |
Plot Panel
Statistics Card
Above the charts, a statistics card displays:
- Total: Count of all measurements
- Accepted: Count with green checkmark and percentage
- Rejected: Count with red X and percentage
Interacting with Data Points
Hover over any scatter point to see a tooltip with:
- Timestamp
- Value
- Sensor
- Status (Accepted/Rejected)
Click a data point to select it:
- Point becomes highlighted
- Tooltip stays visible with action buttons
- Corresponding table row highlights and scrolls into view
Accept/Reject from Plot
When a point is selected, the tooltip shows an action button:
| Current Status | Button Shown | Action |
|---|
| Accepted | Reject | Marks as outlier |
| Rejected | Accept | Removes outlier flag |
Table Panel
Each measurement row displays:
| Element | Description |
|---|
| Checkbox | Click to select for bulk actions (appears on hover) |
| Status Icon | ✓ green (accepted) or ✗ red (rejected) |
| Values | Formatted by type (e.g., “RA 12.3456° DEC -45.6789°“) |
| Epoch | Timestamp in “Jan 15, 14:32:01” format |
| More Menu | ⋮ button for additional actions (appears on hover) |
Row Actions
Click a row (not the checkbox) to focus it:
- Row highlights with a colored ring
- Corresponding point on chart highlights
Click the checkbox to select for bulk actions:
- Row enters selection state
- Floating bulk actions bar appears
Click the ⋮ button on any row to access:
| Action | Description |
|---|
| Accept / Reject | Toggle outlier status for this measurement |
| Accept File | Mark ALL measurements in this file as accepted |
| Reject File | Mark ALL measurements in this file as rejected |
| Delete File | Delete ALL measurements from this file |
Bulk Actions
When one or more rows are selected, a floating toolbar appears at the bottom.
Selection Count
Shows the number of selected measurements out of total visible.
Select All
Selects all visible measurements (after filters are applied).
Reject / Accept Actions
| Option | Description |
|---|
| Reject | Mark selected measurements as outliers |
| Accept File | Mark ALL measurements in selected files as accepted |
| Reject File | Mark ALL measurements in selected files as rejected |
Delete File
Opens a confirmation dialog to delete ALL measurements from the selected file(s).
Delete File removes all measurements from the source file(s), not just the selected rows. This action cannot be undone.
Clear
Deselects all currently selected rows.
Cross-Component Synchronization
The plot and table panels stay synchronized:
| Action | Effect |
|---|
| Click point in plot | Row highlights and auto-scrolls into view |
| Click row in table | Point highlights on chart |
| Click away | Highlights clear in both panels |
Color Coding
Status Colors
| Status | Color | Icon |
|---|
| Accepted | Green | ✓ |
| Rejected/Outlier | Red | ✗ |
Series Colors
When grouping is enabled:
- Sensor grouping: Each sensor gets a unique color
- Spacecraft grouping: Uses spacecraft context colors
- File grouping: Each file gets a unique color
- No grouping: Single default color
The legend displays below the chart, or as color dots in the filter buttons when More Filters is visible.
Loading States
While data is loading, the page displays skeleton placeholders:
- Table: 8 skeleton rows with placeholder shapes matching the actual row layout
- Plot: Loading indicator while chart data is prepared
Chart Limitations
The scatter plot is view-only with the following characteristics:
| Feature | Supported |
|---|
| Zoom | No |
| Pan | No |
| Hover tooltips | Yes |
| Click to select | Yes |
| Data sampling | No (all points rendered) |
Large datasets render all data points without sampling. For very large measurement sets, this may affect chart performance.
Related Pages