
For the complete documentation index, see llms.txt.Ground Track shows spacecraft positions and trajectories at the selected time on an interactive map or globe. If your account has the consolidated Operations Map, open Map (
/map) and follow the Map guide. For these accounts, /orbits/ground-track redirects to Map with ground tracks enabled. Accounts outside that rollout retain Orbits → Ground Track.
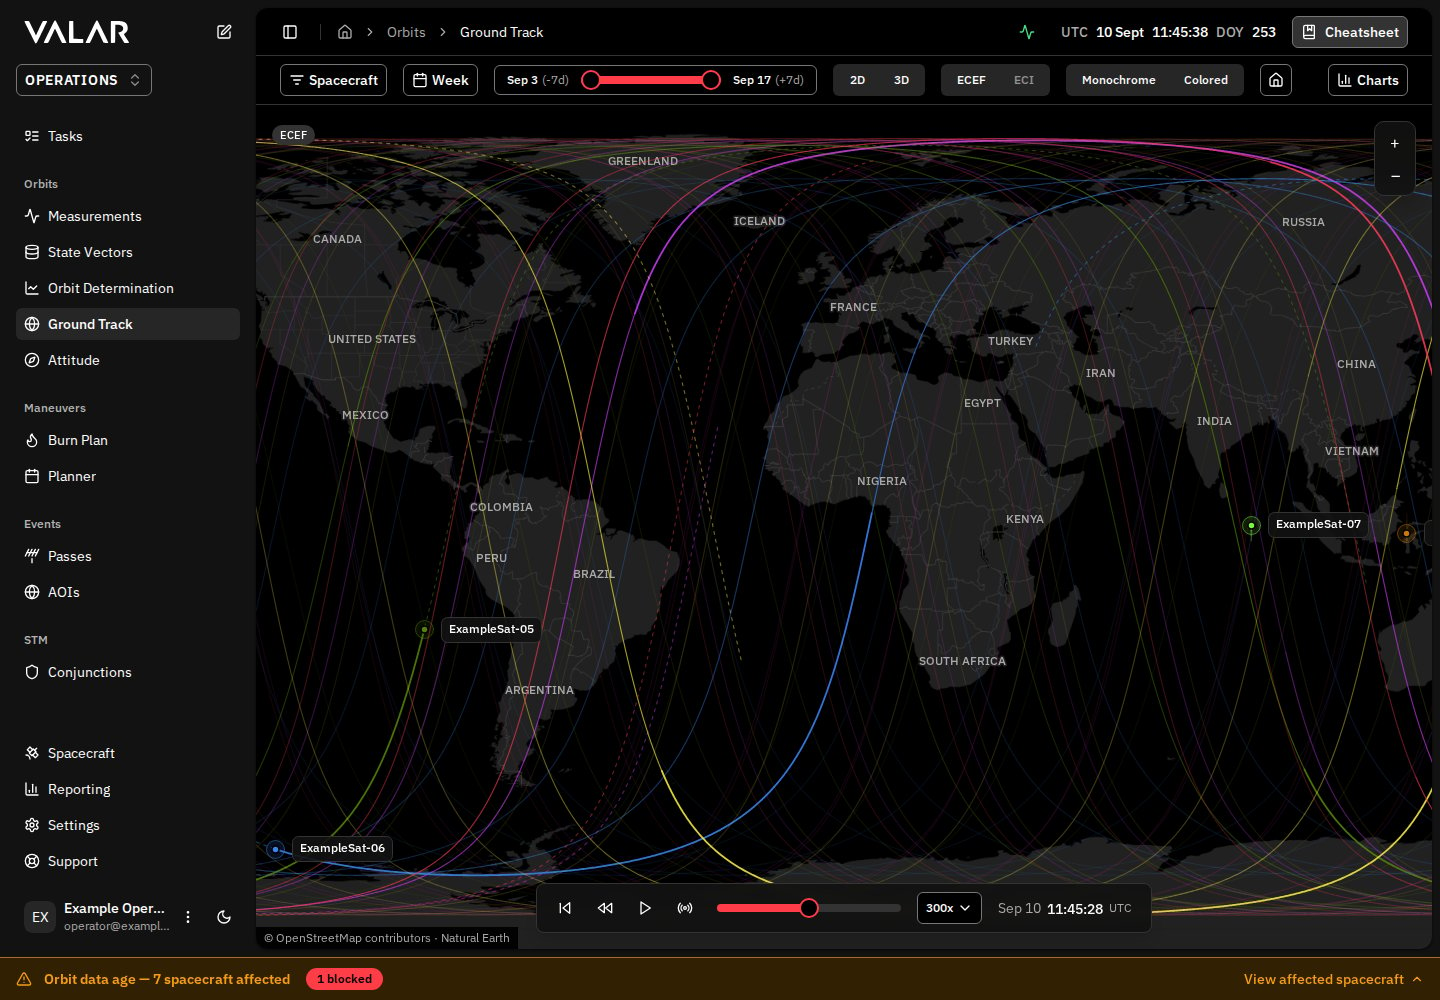
Select spacecraft and a view
The spacecraft filter determines which trajectories appear. With no explicit filter, the page selects the available spacecraft. Apply your selection to update the view. Spacecraft keep their assigned colors across the map and charts.
Changing view preserves the playhead and playback. Each view remembers its camera position. Entering 2D selects ECEF; the 3D frame badge identifies the actual inertial frame, such as GCRF, when ECI is selected. Different inertial frames cannot share a single inertial scene. Use ECEF or select spacecraft with the same inertial frame.
Hover the frame badge for its description and the link to the reference frame catalog.
Geographic backgrounds
The map and globe use Valar-hosted, theme-aware monochrome cartography. Operational objects keep their assigned colours; there is no Monochrome / Colored selector. Light and dark mode change the geographic styling automatically. The worldwide basemap retains regional detail through zoom 8. Closer views reuse that detail while operational geometry remains precise; zooming does not introduce finer geographic source data. In 3D, the surface is the WGS84 ellipsoid, not terrain. If a background cannot load, the page reports it and keeps orbital geometry and navigation available. The background loads independently of orbit computation.Positions and paths
The 2D marker represents the subsatellite point. The 3D marker represents the spacecraft’s physical position. Colors identify the same spacecraft in both views. Labels behind Earth are hidden in 3D; 2D labels are decluttered when they overlap. Paths show up to one hour behind and 24 hours ahead of the playhead, limited to the available orbit data. Ground tracks split at the date line and handle polar crossings. The map does not connect gaps, interpolate through declared maneuver boundaries, or extrapolate beyond supplied data. Click a marker or choose Inspect spacecraft to see its latitude, longitude and ellipsoidal altitude at the playhead. Track spacecraft follows that craft; Stop tracking or Reset view releases it. Longitude is undefined at an exact pole. Displayed decimal places describe the computed position, not orbit uncertainty; uncertainty is shown as unavailable when it has not been supplied. In 3D, illumination follows the supplied Sun direction and selected epoch. It illustrates geometric sunlight; it is not an eclipse-duration or power analysis product. Earth is withheld in ECI when its orientation is unavailable.Navigation
The globe uses damped navigation and respects the reduced-motion preference when the view opens. Map and globe remain navigable while trajectories are loading.
Timeline

- Reset to start: jump to the beginning of the available interval.
- Reverse: play backward; press again to pause reverse playback.
- Play / Pause: start or pause forward playback.
- Sync to real-time: follow the browser clock while it falls within available trajectory data. If it lies outside the data, a message explains why sync is unavailable.
- Timeline slider: seek to a time within the data interval. Seeking exits real-time sync.
- Speed: choose 0.5×, 1×, 2×, 5×, 10×, 50×, 100×, 300× or 1000×. Changing speed exits real-time sync.
Data and charts
By default, the page requests seven days before and seven days after its reference time, with samples every 60 seconds. Use the time-range presets and past/future controls to change that interval. Paths are prepared in a background worker for a bounded window around the playhead. The map appears while these samples are being computed; it does not wait for the complete orbit response before allowing navigation. The existing five-minute per-spacecraft/time-range cache and request deduplication remain in use. Latitude/longitude, latitude-versus-time and longitude-versus-time charts are available in the Charts panel, with hover values and loading or empty states. Display quality notices identify missing or invalid samples, unavailable Earth orientation or illumination, and interpolation gaps. No coordinate or altitude is invented to fill missing data. Orbit propagation accuracy and source freshness remain properties of the selected orbit; geographic background detail does not improve them.When the orbit is stale or unusable
The map draws each spacecraft from a fresh orbit. A spacecraft’s orbit age is measured from its latest state vector — the position and velocity at an epoch you provide through orbit determination, an OPM import, or manual entry. As that age grows it crosses two levels in turn — the degraded level, then the stale level — and the map reacts differently at each. The track normally draws the moment you open the page; on a stale orbit it waits for you to choose to proceed. What you see depends on the selected spacecraft’s orbit age:
Both
N values are whole days — the spacecraft’s actual orbit age and your configured stale level. The stale and degraded levels are workspace-wide values set once in Settings → Orbits → Orbit age (stale level default 14 days); the same values govern the Keplerian-elements plot and AOI overflight, changed in one place rather than per surface. See Orbit age for the workspace-wide policy and the block message.
Every spacecraft affected at either level is also named in the unified orbit-data-age footer at the bottom of the page — tagged Degraded at the degraded level, or Blocked once past the stale level — so you can see which spacecraft are affected at a glance.