For the complete documentation index, see llms.txt.
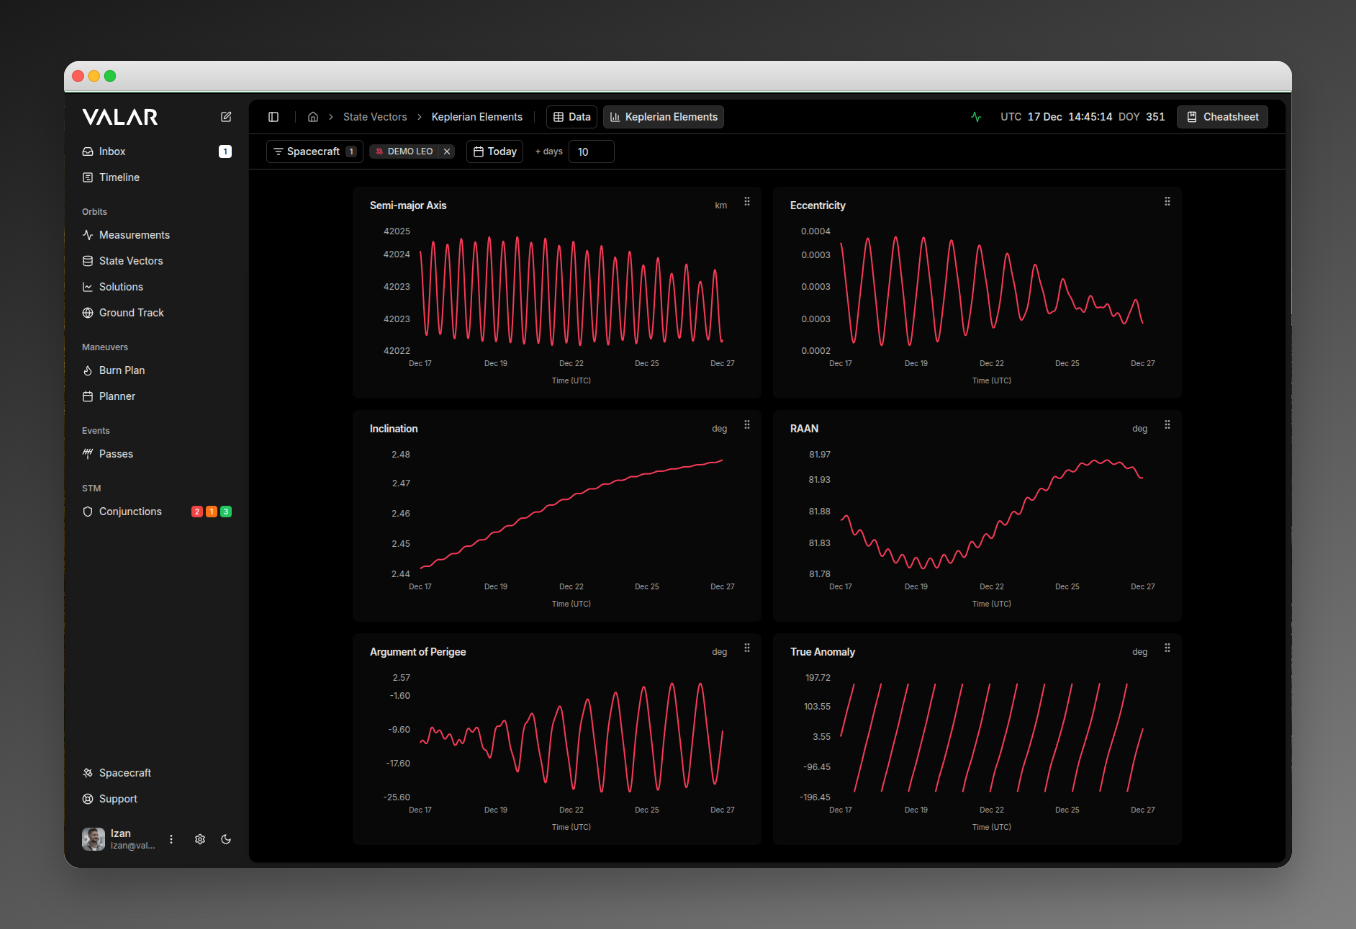
The Keplerian Elements page displays time-series visualizations of the six classical orbital elements for your spacecraft. Each element is shown in its own chart card, and you can filter by spacecraft and reorder the cards to customize your view.
Route: /state-vectors/keplerian-elements
Page Layout
Orbital Elements Displayed
The page shows 6 Keplerian orbital elements in a 2-column grid:
| Element | Symbol | Unit | Description |
|---|
| Semi-major Axis | a | km | Half the longest diameter of the orbital ellipse |
| Eccentricity | e | - | Shape of the orbit (0 = circular, less than 1 = elliptical) |
| Inclination | i | deg | Tilt of the orbit relative to Earth’s equator |
| RAAN | Ω | deg | Right Ascension of Ascending Node - where orbit crosses equator going north |
| Argument of Perigee | ω | deg | Angle from ascending node to closest point to Earth |
| True Anomaly | ν | deg | Current position of spacecraft along the orbit |
Spacecraft Filter
Filter which spacecraft are plotted on all charts.
| Element | Description |
|---|
| Location | Top-left of page |
| Control | Multi-select dropdown with badge |
| Default | Shows all spacecraft when none selected |
- Click to open popover dropdown
- Check/uncheck spacecraft to display
- Click Apply to confirm selection
- Click Clear All to deselect all
- Remove individual spacecraft via X button on badges
Effect:
- Filters which spacecraft are plotted on all charts
- Each spacecraft shown as separate colored line
- URL updates to persist selection
Element Cards
Card Structure
Each orbital element is displayed in a card containing:
 Header Elements:
- Element Name: e.g., “Semi-major Axis”
- Unit: e.g., “km” or “deg”
- Reference Frame Indicator: A small chip showing the frame the element values are expressed in (e.g.,
GCRF). Hover for the full frame name; click Learn more to open the reference frame catalog. The badge appears on every element card on this page.
- Drag Handle: Grip icon for reordering
Chart Visualization
Each chart displays:
X-Axis: Time (UTC)
- 5 evenly-spaced tick labels
- Shows date/time labels
Y-Axis: Element value
- Auto-scaled to fit data
- Formatted by element type:
- Semi-major axis: Integer km values
- Eccentricity: 4 decimal places
- Angular elements: 2 decimal places with °
Lines:
- One line per selected spacecraft
- Color-coded by spacecraft
- Smooth curve interpolation
- No dots on data points (clean lines)
Drag-and-Drop Reordering
How to Reorder Cards
Each card has a grip icon in the top-right corner.
To reorder:
- Hover over the drag handle - cursor changes to grab
- Click and hold the drag handle
- Drag the card to desired position
- Release to drop
Visual Feedback:
- Dragged card shows preview overlay
- Original position becomes semi-transparent (30% opacity)
- “Chart hidden during reordering” message displays
- Smooth animation when cards swap positions
Keyboard Support
- Use arrow keys to rearrange cards (when focused on drag handle)
- Tab to navigate between drag handles
Order Persistence
- Your custom order is automatically saved to browser storage
- Persists across page reloads and sessions
- Stored with key
keplerian-elements-order
Default Order
- Semi-major Axis
- Eccentricity
- Inclination
- RAAN
- Argument of Perigee
- True Anomaly
Chart Interactions
Hover over any point on a chart line to see values:
 Value Formatting:
- Semi-major Axis: Localized number with “km” (e.g., “7,012.34 km”)
- Eccentricity: 4 decimal places (e.g., “0.0012”)
- Angular elements: 2 decimal places with ° (e.g., “98.52°“)
Active Point Indicator
When hovering:
- Small filled circle appears at exact data point
- Circle matches spacecraft color
- White border for visibility
Cursor Line
- Dashed vertical line follows cursor
- Helps align values across time axis
Angular Element Handling
For angular elements (Inclination, RAAN, Argument of Perigee, True Anomaly):
Discontinuity Handling:
- Charts automatically detect wrapping at 0°/360° boundaries
- Line breaks at discontinuities to prevent unrealistic connections
- Thresholds:
- Inclination: 90° jump threshold
- RAAN, Arg. of Perigee, True Anomaly: 180° jump threshold
This ensures clean visualization without diagonal lines crossing the entire chart when angles wrap around.
Data & Time Range
Default Data Range
| Direction | Range |
|---|
| Past | 1 day backward from current time |
| Future | 1 day forward from current time |
Data Resolution
- Time step: 5 minutes (300 seconds)
- Sufficient detail for orbital trends without overwhelming the charts
Data Caching
- Results cached per spacecraft/time range
- Prevents redundant API calls when switching views
When the orbit is stale or unusable
The charts plot each spacecraft from a fresh orbit. A spacecraft’s orbit age is measured from its latest state vector — the position and velocity at an epoch you provide through orbit determination, an OPM import, or manual entry. As that age grows it crosses two levels in turn — the degraded level, then the stale level — and the page reacts differently at each. The charts normally compute the moment you open the page; on a stale orbit they wait for you to choose to proceed.
What you see depends on the selected spacecraft’s orbit age:
| Orbit state | What the charts show |
|---|
| Fresh (within both levels) | The element charts plot normally — nothing extra. |
| Degraded (past the degraded level) | The charts plot from the platform-fetched public TLE, with an inline aging notice above them reading This spacecraft’s orbit is stale, the orbit’s age (last determined N days ago), and the level it crossed (exceeds your N-day threshold). When the fallback orbit is itself stale, the notice adds the public-TLE fallback is also stale. The charts still draw — the notice is a heads-up, not a block. |
| Stale (past the stale level) | The charts are held until you choose to proceed. In place of the element charts, the page shows the same This spacecraft’s orbit is stale panel — with the age and threshold lines — plus a Compute anyway button. Click Compute anyway to plot the element series from the stale orbit. |
| No usable orbit | When a selected spacecraft has no orbit data of any kind to plot from, the charts are replaced by a panel reading Can’t compute — {spacecraft} has no usable orbit, explaining that There is no usable orbit data for this spacecraft, so this product can’t be computed. Add tracking data to continue, with an Add orbit data button that opens the Spacecraft page. This is never shown as a raw error. |
N values are whole days — the spacecraft’s actual orbit age and your configured stale level. The stale and degraded levels are workspace-wide values set once in Settings → Orbits → Orbit age (stale level default 14 days); the same values govern the ground-track map and AOI overflight, so “stale” means one consistent thing across all three. See Orbit age for the workspace-wide policy and the block message.
Every spacecraft affected at either level is also named in the unified orbit-data-age footer at the bottom of the page — tagged Degraded at the degraded level, or Blocked once past the stale level — so you can see which spacecraft are affected without inspecting each chart. Loading & Error States
| State | Display |
|---|
| Initial load | Skeleton placeholders in each card |
| Data loading | Skeleton animation while fetching |
| Switching spacecraft | Brief loading state (500ms) |
| During drag | ”Chart hidden during reordering” message |
| No data | ”No data available” message with description |
| Error | Red error message below the top bar |
Color Coding
Each spacecraft has a unique color that is consistent across:
- Chart lines
- Tooltip indicators (colored dots)
- Spacecraft filter badges
Colors are assigned from a predefined palette and retrieved from the spacecraft context. While there’s no separate legend component, spacecraft colors are visible through selected spacecraft badges in the filter and tooltip color indicators when hovering on charts.
Quick Reference
| Category | Action | How To |
|---|
| Filter | Select spacecraft | Topbar dropdown |
| Filter | Clear all selections | ”Clear All” button in dropdown |
| Filter | Remove single spacecraft | X button on badge |
| View | See element values | Hover over chart |
| Reorder | Move card | Drag grip handle |
| Reorder | Keyboard reorder | Arrow keys on handle |
| View | Compare spacecraft | Select multiple in filter |
Understanding Keplerian Elements
Keplerian elements are six parameters that uniquely define an orbit:
- Semi-major Axis (a): Determines the size of the orbit
- Eccentricity (e): Determines the shape (0=circle, 0-1=ellipse)
- Inclination (i): Tilt relative to Earth’s equator
- RAAN (Ω): Orientation of where orbit crosses equator
- Argument of Perigee (ω): Orientation of closest approach point
- True Anomaly (ν): Current position along the orbit
Why Track These Over Time?
- Detect orbital drift: Semi-major axis changes indicate altitude changes
- Monitor stability: Eccentricity variations show orbit shape changes
- Track precession: RAAN and Argument of Perigee naturally precess
- Verify maneuvers: Changes in elements after planned burns
- Predict decay: Long-term trends in semi-major axis